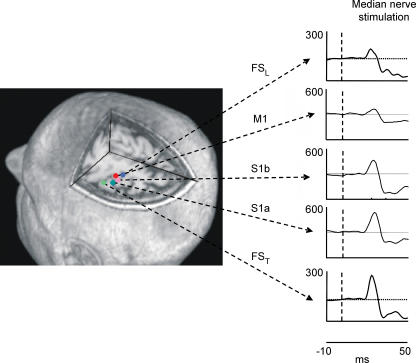
Figure 4. FS positions and behaviour.
Left, position in one representative subject of extracted sources representing the thumb cortical network (FST), the median nerve connected sensory areas (S1a, S1b), the primary motor area (M1) and the little finger cortical network (FSL) in the left hemisphere projected on a representative axial section. Right, dynamics of FSL, S1a, S1b, M1 and FST activities during contralateral median nerve stimulation, shown after averaging the source signal timed on the stimulus onset (t = 0, vertical dashed line) in the [−10, 50] ms time window. Note that S1a responsiveness is maximal around 20 ms, S1b around 30 ms, and M1 responded more at 30 ms than at 20 ms (see text). Note that the y axes do not have measurable units, as FSs do not have a physical unit dimension, before retro-projection on the original signal space.

