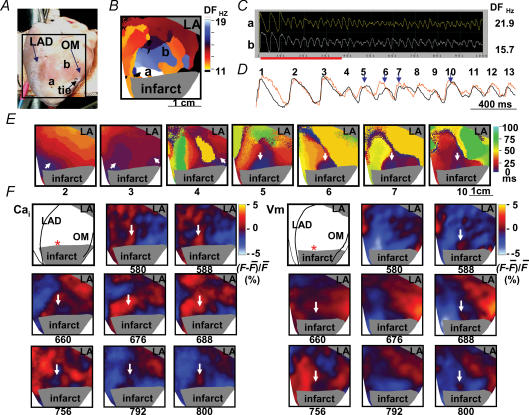
Figure 3. Consecutive focal discharges with Cai prefluorescence at the onset of ventricular fibrillation.
A, shows the mapped region. B, shows dominant frequency map during ventricular fibrillation. C, shows an example of optical recording. D, shows the rise of Cai (orange) preceding the elevation of Vm in beats 5, 6, 7 and 10 (downward blue arrows) at site labelled a during the onset of ventricular fibrillation. E, shows isochronal maps of beats 2–7 and beat 10, which included the paced beat before ventricular fibrillation (beat 2) and beats during the development of ventricular fibrillation. These isochronal maps were drawn based on optical recordings of Vm. White arrows indicate the direction of wavefront propagation (beats 2–4) or focal discharges (beats 5–7 and 10) from the peri-infarct zone. F, shows Cai and Vm maps that demonstrated Cai prefluorescence in beats 2–4 at onset of ventricular fibrillation. DF, dominant frequency; OM, obtuse marginal branch of left circumflex artery; LAD, left anterior descending artery.

