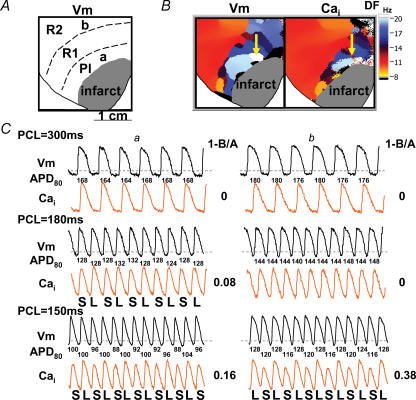
Figure 5. Cai and Vm alternans.
Data from the same rabbit as in Fig. 4A, a and b indicate sites with the earliest Cai transient alternans at the peri-infarct zone and at left ventricle base, respectively. B, dominant-frequency map during ventricular fibrillation. The highest dominant frequency was located at the peri-infarct zone (yellow arrow), corresponding to site a in A. C, shows Cai (orange) and Vm (black) recordings at sites a and b when the ventricles were paced at pacing cycle lengths of 300 ms, 180 ms and 150 ms. The numbers below each Vm tracings are APD80 values. S, small amplitude; L, large amplitude; 1−(B/A), alternans ratio; R1 and R2, remote zones 1 and 2, respectively.

