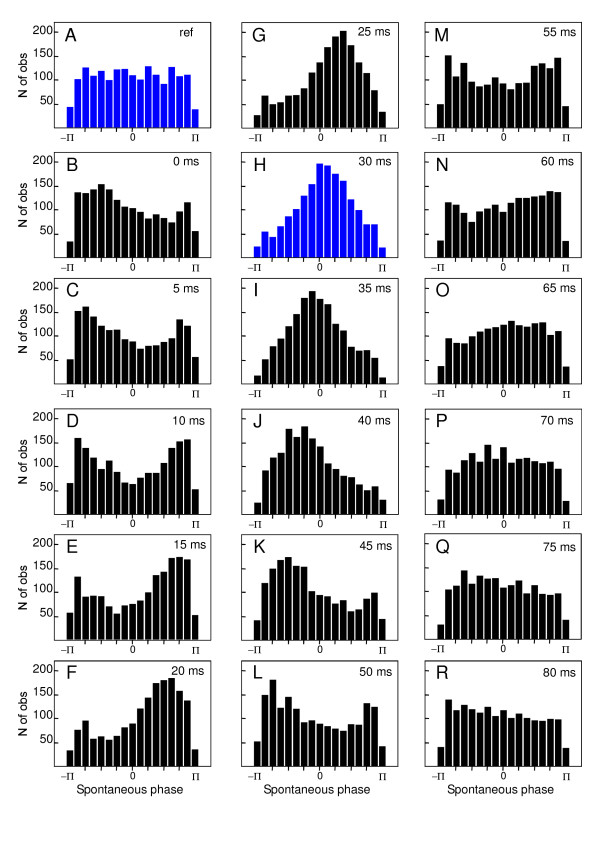
Figure 4.
Reorganization of the spontaneous phase of beta oscillation. Cumulative histograms of the spontaneous phase of single trials beta band oscillation (25–35 Hz) recorded in all the subjects (pooled as a single set) and selected with respect to the pure phase-locking criteria. Horizontal axis ranges from -π to π. Vertical axis corresponds to the number of trials. A, histogram of the pre-stimulus reference period ([-60 ms,-5 ms]). B-R, succession of histograms calculated every 5 ms, from 0 to 80 ms with respect to the stimulation time. Note the progressive reorganization of phase distribution peaked at 0 radian at 30 ms.

