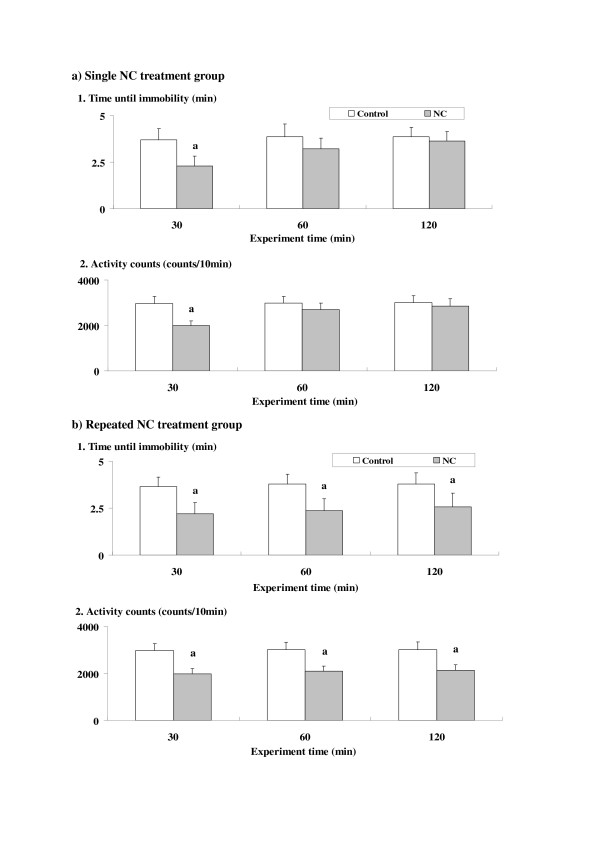
Figure 2.
Time courses of nicotine (NC)-induced depression-related behavioral alterations in the forced swimming test. The parameter values at 30, 60 and 120 min time points after the NC treatment are shown for the single (a) and repeated (b) NC treatment groups. Data represent means ± SD (n = 7 for each group). The symbols for differences are the same as in the other figures.

