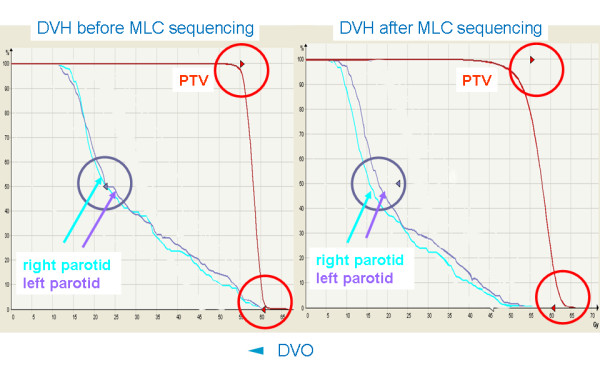
Figure 3.

Comparision of the DVH of a plan optimized with IM before and after MLC sequencing. The DVO for the parotids (purple arrow) and PTV (red arrows) are closely met before MLC sequencing (left hand side). After MLC sequencing (right hand side) the DVH of the PTV becomes shallower, the DVO are severely violated. At the same time the median dose to the parotids, which was close to the DVO before segmentation, becomes lower after segmentation, over-fullfilling the DVO.
