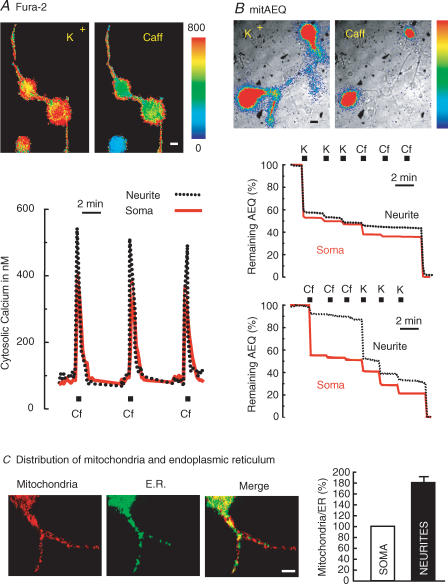
Figure 5. Differential effects of stimulation with high K+ and caffeine in the cell body and the neurites.
A, effects on [Ca2+]c measured with fura-2 as described in Methods. Sixty-four 256 × 256 pixel images at alternate excitation wavelengths (340 and 380 nm) were averaged and ratioed by hardware every 5 s. Spatial resolution was of 1 μm per pixel. Results are representative of 4 similar experiments. B, effects on [Ca2+]m measured with mitAEQ (high-Ca2+-affinity system). The first high-K+ stimulation released 37 ± 4% of the total photonic emissions in neurites; the second and subsequent stimuli released 3 ± 1% (mean ± s.e.m. of 20 cells from 15 experiments). The first caffeine stimulus induced a very small aequorin consumption in neurites (5 ± 1% of total photonic emissions; mean ± s.e.m. of 22 cells from 16 experiments); the subsequent stimulation with high K+ consumed 21 ± 2% of aequorin. Regions of interest for measurements were defined selectively either in soma or neurites. Other details are as in Figs 1 and 2. C, analysis of relative content of mitochondria and ER in soma and neurites of sympathetic neurons. A sample of confocal slicing of a neuron expressing ER-GFP (green) and loaded with Mitotracker Red® (red) and the merged image are shown. The right-hand panel compares the contents of soma and neurites for 12 neurons (mean ± s.e.m.). The values are expressed as mitochondria/ER ratio and were normalized to 100% for the soma content in each case (*P < 0.001). Bars in images represent 10 μm.

