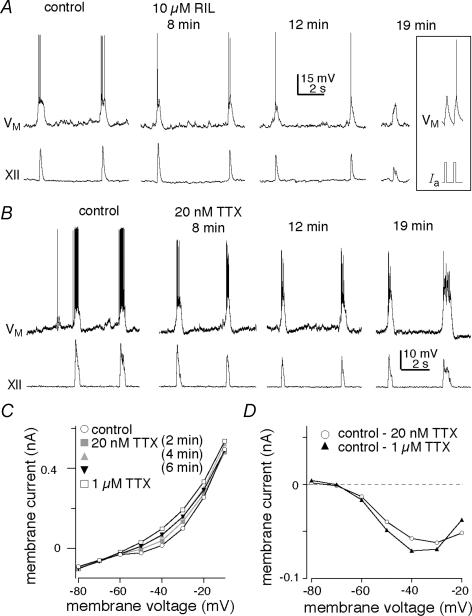
Figure 4. The role ofINaP in inspiratory drive potentials.
A and B, sample traces of two consecutive inspiratory cycles are shown for control and 10 μm RIL (A) and 20 nm TTX (B) at 8, 12 and 19 min. Inset in A shows spikes evoked by 5 ms current pulses to show that RIL did not attenuate action potentials even after > 20 min of exposure. A and B have separate scale bars. Baseline membrane potential was –60 mV. C, steady-state I–V curve measured in the presence of low Ca2+ solution and 200 μm Cd2+ showing control (open circles) and the blockade of inward rectification due to INaP by 20 nm TTX at membrane potentials greater than –60 mV. Conditions with 20 nm TTX are shown at 2 min (grey boxes), 4 min (grey triangles), and 6 min (black inverted triangles). Note: 4 and 6 min trials overlie one another and thus indicate 20 nm TTX effects at steady state. The subsequent application of 1 μm TTX (open squares) caused some additional attenuation of the inward rectification above –60 mV. D, TTX-sensitive subtracted currents: the 20 nm TTX (6 min) I–V curve was subtracted from the control I–V curve to reveal the 20 nm TTX-sensitive current (open circles). The 1 μm TTX-sensitive current (black triangles) was obtained by subtracting the 1 μm TTX I–V curve from control.

