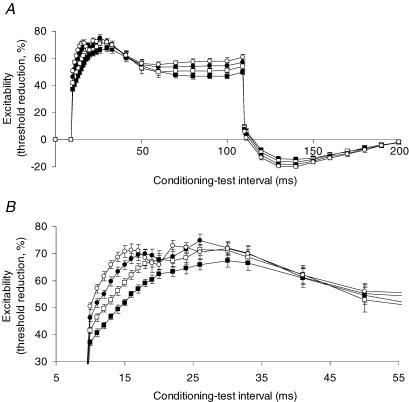
Figure 4. Evolution of the ‘notch’ with increasing depolarizing conditioning currents.
A, threshold electrotonus with a 100 ms depolarizing conditioning current set to +40% (▪), + 45% (□), +50% (•) and +55% (○) of the threshold for the test potential recorded from motor axons using 1.0 ms wide test stimuli. B, detail from A of threshold changes occurring at conditioning–test intervals between 5 ms and 50 ms. Data are means ± s.e.m. for 6 subjects (data from the incomplete recording from one subject are not included).

