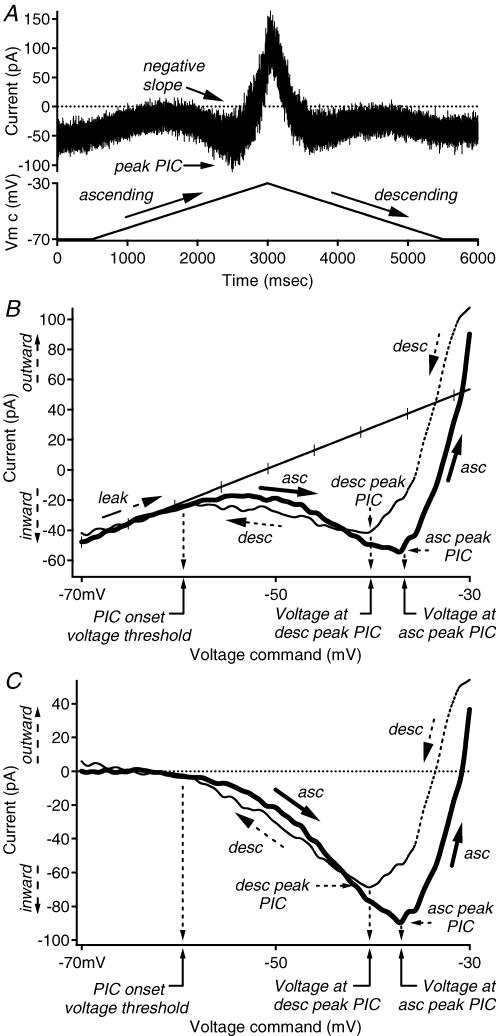
Figure 1. Defining quantification of I–V properties.
A, raw data example of the current response (top trace, in pA) to a ramp voltage command (bottom trace, in mV) recorded during voltage clamp. Voltage ramps typically began and ended at −70 mV, and ascended and descended at the same absolute rate, ∼8–16 mV s−1. B, the current–voltage (I–V) relation was constructed by expressing the current trace as a function of the voltage command. The x axis is the voltage command (in mV), and the y axis is the current response (in pA). The leak conductance is indicated by the hash-marked trace. For convention, outward currents are expressed as positive values, and inward currents are expressed as negative values. C, the leak-subtracted I–V relation was produced by subtracting the leak conductance from the I–V relation in B. Peak PIC, voltage at peak PIC and PIC onset are shown and calculated as described in the data analysis section of the Methods. The x axis is the voltage command (in mV), and the y axis is the current response (in pA). Abbreviations: asc: ascending; desc: descending; leak: leak conductance; PIC: persistent inward current.

