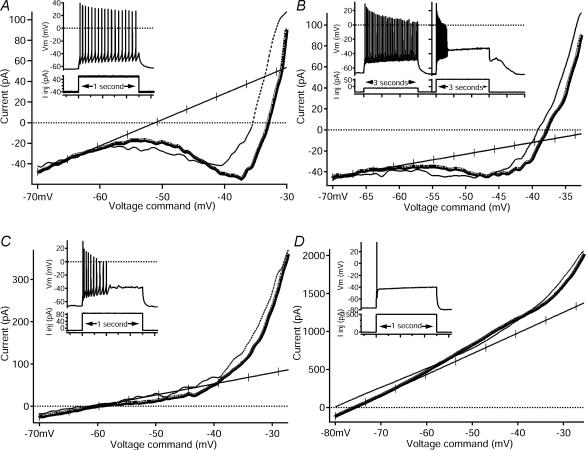
Figure 5. Comparison of I–V relations among repetitive-firing, repetitive/burst, initial-burst and single-spiking cells.
In all panels, insets are from Fig. 3 and show the firing pattern (top trace, membrane potential, Vm, in mV) in response to a depolarizing, square pulse of injected current (bottom trace, injected current, Iinj, in pA) that corresponds to the I–V relation. On all I–V traces, the voltage command is on the x axis and the current is on the y axis. (Note: the y axes scales are different in each example.) Ascending phases of the I–V are shown with thick lines, and descending phases are shown with thin lines. The line of leak conductance is hash-marked. A, this fully repetitive-firing cell responded with sustained firing (see inset, also Fig. 3A) to a depolarizing input. The I–V relation (same cell from Figs 1 and 4A) revealed a large PIC with a negative slope region. B, this repetitive/burst cell displayed the characteristic repetitive firing to one depolarizing input and burst firing to another (see inset, also Fig. 3D). A moderate-amplitude PIC with a negative slope was seen in the I–V relation of this cell. C, this initial-burst cell responded with a brief burst of spikes (see inset, also Fig. 3B) to a depolarizing input. A moderate-amplitude PIC with no negative slope was seen in the I–V relation. Note that the current and voltage scales are larger than in A and B. D, the single-spiking cell (see inset, also Fig. 3C) fired only one spike to a depolarizing input. No net inward currents were seen in the I–V relation, resulting in a 0 pA PIC. Note that the current and voltage scales are larger than in A, B and C.

