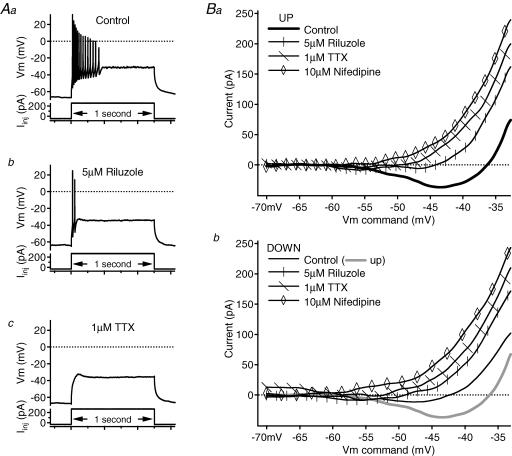
Figure 8. Contribution of NaP and L-type calcium conductances to the PIC of an initial-burst cell.
A, in the control condition (Aa), the cell fired a high-frequency burst of spikes to a 1 s depolarizing current pulse. A 5 μm riluzole application (Ab) reduced firing to two spikes, and 1 μm TTX application (Ac) eliminated the remaining spikes. In all of the panels, firing responses (membrane potential, Vm, in mV) are shown above the corresponding depolarizing, 1 s current pulses (Iinj in pA). B, in the leak-subtracted I–V relations, each subsequent drug application blocked more of the PIC on both the ascending (Ba) and descending (Bb) phases. On both panels, the voltage command (in mV) is on the x axis, and the current (in pA) is on the y axis; riluzole traces have vertical marks, TTX traces have diagonal marks and nifedipine traces have open diamond markers. Control traces are slightly thicker and unmarked. On the descending-phase I–V graph (Bb), the ascending control trace is also shown as a thicker, grey line.

