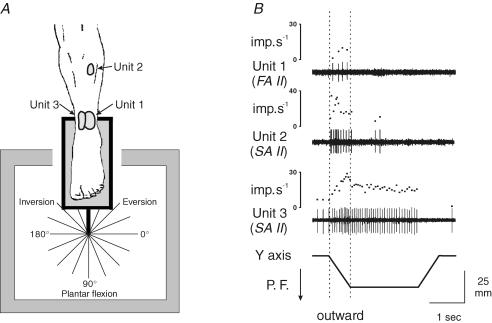
Figure 2. Typical patterns of cutaneous response to ramp-and-hold movements.
A, location of the receptive fields of three cutaneous afferents tested in three subjects and diagram showing the 16 directions tested, where 270 deg corresponds to a dorsiflexion and 90 deg to a plantar flexion movement. B, response of these afferents during ramp-and-hold movements imposed in the direction of a plantar flexion (P.F.). The activity of each unit is illustrated by its spike train and the corresponding instantaneous frequency curve in response to movements along the vertical y axis. For further analysis, the mean discharge frequency was measured only during the outward movement (dotted vertical bars).

