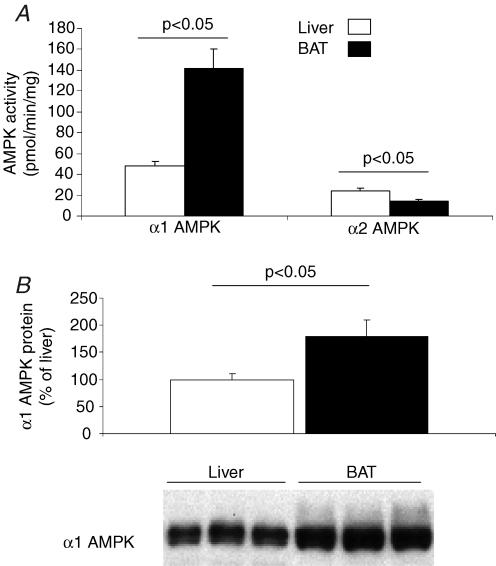
Figure 1. Comparison of AMPK activity in mouse BAT and liver.
A, activities of α1 AMPK and α2 AMPK were measured in homogenates of BAT and liver from mice, following immunoprecipitation with isoform-specific antibodies. Activities were determined in the presence of 200 μm AMP. Data are expressed as mean ± s.e.m. for n=5 in each group. B, Western blots were performed on homogenates of BAT and liver from mice. Immunoblots were probed with antibodies directed against α1 AMPK protein.

