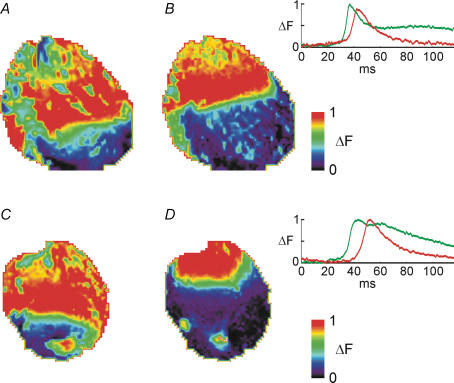
Figure 1.
Fluorescence images showing the activation wavefronts during activation in response to pacing near the base of the left ventricle (top of image) in a control heart in normal Krebs solution (A); the same control heart in the presence of 0.5 mm heptanol (B); a diabetic heart in normal Krebs solution (C); and the same diabetic heart in the presence of 0.5 mm heptanol (D). All images show the state of activation 23.6 ms after the onset of the stimulus pulse. Note the considerably more pronounced slowing in response to heptanol in the diabetic heart (C and D) compared to the control heart (A and B). The colour scale shows fluorescence after background subtraction, a measure of membrane potential, with red corresponding to the most depolarized potentials. All data were signal averaged over approximately 20 activation cycles (see Supplemental material, Appendix A). The insets show optically recorded action potentials (APs) from a pixel near the apex of the left ventricle of the two hearts shown. Green lines show APs in normal Krebs solution, and red lines show APs in the presence of 0.5 mm heptanol. (Upper panel, APs in the control heart; lower panel, APs in the diabetic heart.) Note the considerably larger delay in response to heptanol in the diabetic heart compared to the control heart. Data were signal averaged over approximately 20 cycles.

