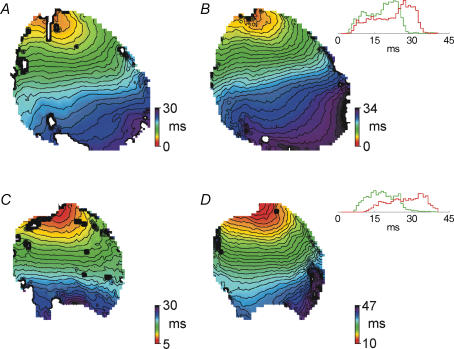
Figure 2.
Isochronal maps (1 ms isochrones) showing activation in response to pacing near the base of the left ventricle (top of image) in a control heart in normal Krebs solution (A); the same control heart in the presence of 0.5 mm heptanol (B); a diabetic heart in normal Krebs solution (C); and the same diabetic heart in the presence of 0.5 mm heptanol (D). Insets in B and D show histograms constructed from the times of activation for individual points on the preparation (the data shown in the colour maps). Green histograms represent activation in normal Krebs solution and red histograms activation in the presence of 0.5 mm heptanol. The widths of these histograms at 20% of peak levels were used as a measure of the total activation time of the preparation. Note the considerably more pronounced broadening of the histogram in response to heptanol in the diabetic heart (inset in D) compared to the control heart (inset in B). The colour scale in the isochronal maps shows the time of activation at each point on the preparation, with red corresponding to the points activated the earliest. All times are with reference to the onset of the stimulus pulse for example (a point with time of activation=5 ms is activated 5 ms after the onset of the stimulus pulse). Activation data were averaged over approximately 20 activation cycles.

