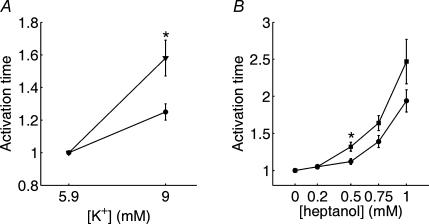
Figure 3.
Summary data showing the effect of increased [K+] (A) and increasing concentrations of heptanol on the activation time (width of histograms shown in Fig. 3) (B). Activation times for each preparation were normalized to the value obtained in normal Krebs solution to account for differences in heart size. *Statistical significance (t test with P < 0.05). Slowing in response to elevated [K+], as well as heptanol application, was significantly more pronounced in diabetic hearts than in control hearts under the same conditions. Data shown are based on n=6–7 for [K+] (A) and n=8–9 for heptanol concentrations of 0.5 mm or less (B). Data for heptanol concentrations greater than 0.5 mm are based on n=4–6 due to lower success rate (complete conduction failure in some preparations) at these higher concentrations.

