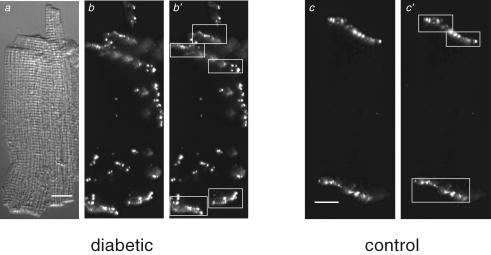
Figure 7. Analysis of lateralization of Cx43.
Panels a–b′, differential interference contrast (a) and immunofluorescence (b and b′) images of an isolated ventricular myocyte from an STZ-diabetic rat heart labelled with anti-Cx43. Panels c and c′: immunofluorescence images of an isolated ventricular myocyte from a non-diabetic (control) rat heart labelled with anti-Cx43. White rectangles in b′ and c′ surround the intercalated discs. To identify the intercalated discs in images, the images were first temporarily rescaled (using Photoshop software) so that the entire cell could be seen in an image. This made the disc regions more evident. The disc regions were then surrounded by boxes (panels b′ and c′) and the pixel intensities within the boxes were set to the background level for the analysis of lateralization (using locally written software) as described in the text. To rule out possible biasing in choosing the cellular regions associated with the intercalated discs in the images, the same set of images was analysed separately by two individuals. Results from the two separate analyses were not significantly different from one another. Scale bars in panels a and c represent 10 μm. Cells were labelled with anti-Cx43 primary antibody and secondary antibody conjugated to Alexa 488.

