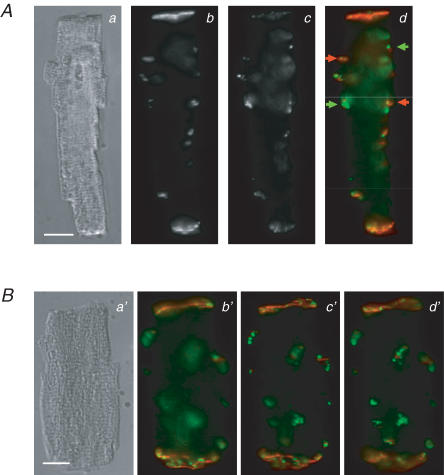
Figure 9. Distribution of N-cadherin and connexin 43 in isolated left ventricular cardiac myocytes from STZ-diabetic rats.
A, differential interference contrast (DIC) micrograph of an isolated myocyte (a) and immunofluorescence images showing the distribution of N-cadherin (b) and Cx43 (c) in the myocyte. Panel d is an overlay of the images in b (pseudo-coloured red) and c (pseudo-coloured green). Green arrows in c point to lateralized Cx43 labelling that is not co-localized with N-cadherin; red arrows point to lateralized Cx43 labelling that is co-localized with N-cadherin labelling. B, DIC micrograph (a′) and three image planes (b′–d′) of a second cell dual-labelled with anti-connexin 43 (green) and anti-N-cadherin (red). Cells were dual-labelled as described in Methods; scale bars in a and a′ represent 10 μm. Cells were dual-labelled with polyclonal anti-connexin 43 (secondary antibody was conjugated to Alexa fluor 488) and monoclonal anti-N-cadherin (secondary antibody was conjugated to Cy3).

