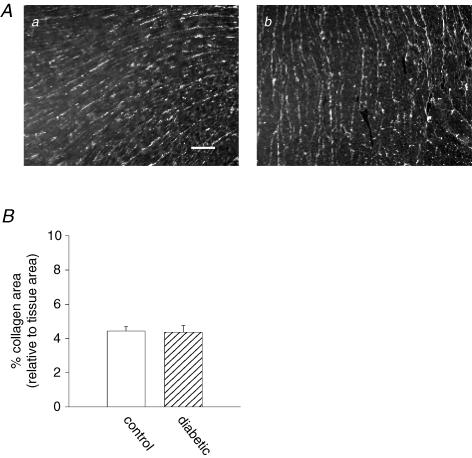
Figure 11. Analysis of the collagen content of ventricular tissue from control and diabetic rats.
Aa, immunofluorescence image of a thin section from a control rat ventricle labelled with anti-collagen III; Ab, similarly labelled image from a diabetic rat ventricle (scale bar in a, 100 μm). B, summary of analysis of images of anti-collagen III-labelled ventricular sections. Results are expressed as percentage of tissue area occupied by collagen III. Area occupied by collagen in the control sections was not significantly different from that occupied by collagen in the diabetic sections (P=0.9). Thirty control and 30 diabetic images were analysed (10 of each were collected with a ×40 objective and 20 with a ×10 objective).

