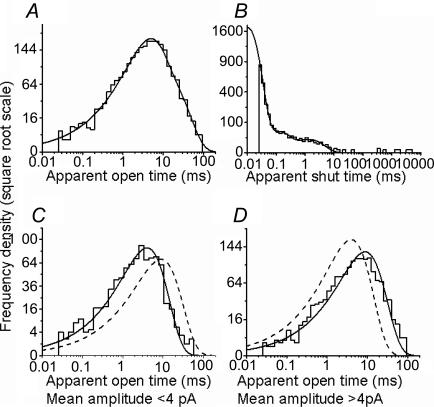
Figure 5. In outside-out patches, GlyR openings to the largest conductance are longer than those to lower conductance levels.
A and B show the dwell time distributions for spinal GlyRs recorded in the outside-out configuration and constructed including all conductance levels. C and D show conditional open period distributions, plotted for openings to the largest conductance (greater than 4 pA at −100 mV, D) or to the two smaller conductances (less than 4 pA, C). In D, the dashed line shows for reference the exponential fitted to the distribution in C (and vice versa), scaled to contain the same number of events. The longer duration of the larger openings is very apparent.

