
Figure 3.
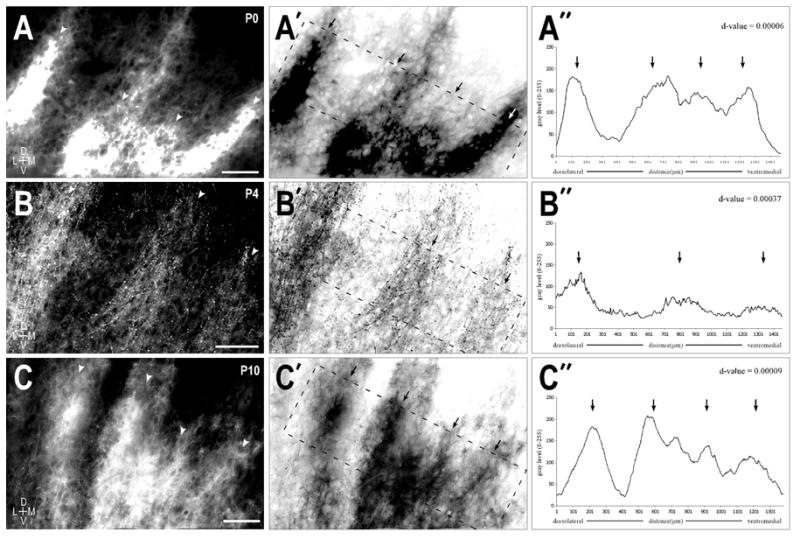
Uncrossed LSO afferent layers at P0 (A series), P4 (B series), and P10 (C series). A. Fluorescent micrograph of prominent axonal layers (arrowheads) in the left IC at birth. A′. Inverted image of (A) highlighting the area (dashed rectangle) used to generate the brightness plot profile shown in (A″). A″. Brightness profile graph where peaks correspond to afferent dense areas (arrows) and troughs correspond to less dense interband spaces. Layers within the rectangular sample were rotated to vertical to facilitate quantification of the bands in an averaged columnar fashion. A Durbin-Watson statistical autocorrelation test was performed on the raw brightness profile values to extract any periodicity in the data set. B & C series. Same progression as described for the A series. The resultant d-values tending to 0 were indicative of a very strong periodicity at each of these early postnatal stages. Scale bars = 100 μm.