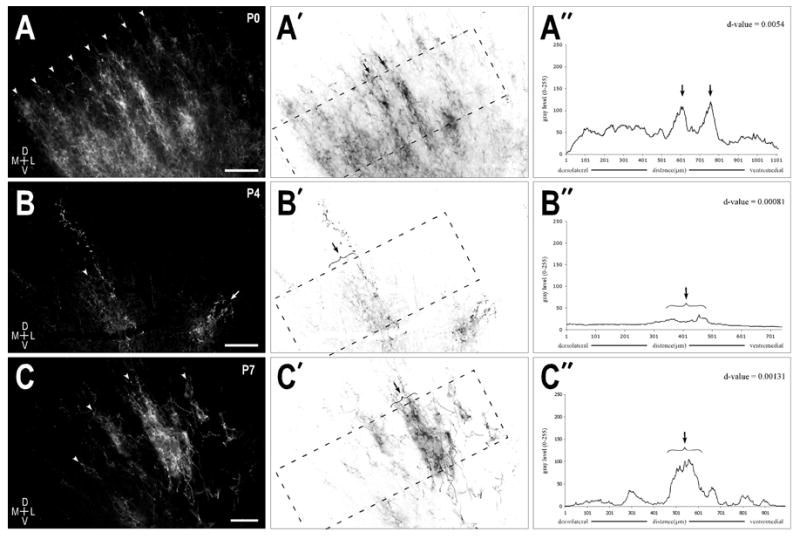
Figure 4.

Crossed LSO afferent layers at P0 (A series), P4 (B series), and P7 (C series). A. Alternating axonal layers (arrowheads) in the right IC at birth following a large dye placement in the contralateral LSO. A′. Inverted image of (A) highlighting the area (dashed rectangle) used to generate the brightness plot profile shown in (A″). A″. Raw brightness profile data showing prominent afferent bands (arrows) and a distribution pattern that again produced a d-value (0.0054) suggestive of a strong periodicity. B & C series. Same progression as described for the A series. Dye placements in the contralateral LSO for (B) and (C) were more localized than in (A), thereby yielding fewer afferent layers in the central nucleus of the IC. Autocorrelative d-values again indicated the presence of a strong periodicity in the distributions patterns of the crossed LSO projection throughout the first postnatal week. Scale bars = 150 μm.
