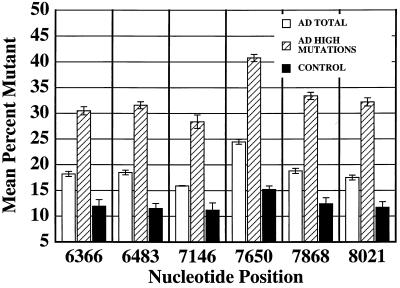
Figure 2.
Quantitative analysis of the relative amounts of each of the six mutations identified by competitive primer extension assays. Each bar represents the group mean percentage of the mutant base relative to the wild-type base. AD total group represents the entire AD population studied. The AD high mutations group represents the mutational load at each mutant base for AD cases with levels of the mutant molecule exceeding those of any control case. The AD high mutation group included ≈20% of the AD total population. Error bars represent the SEM for each group. At each site, AD cases had significantly higher levels of the mutant base than controls as determined by independent t tests (P < 0.001).

