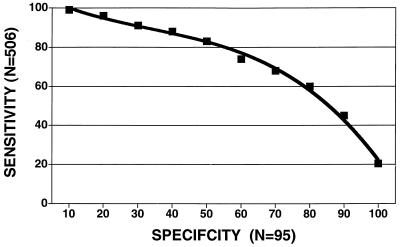
Figure 3.
Receiver operating characteristic (ROC) curve presenting the sensitivity (percentage of AD cases with the relative proportions of the 7650 mutant base above a selected value) and specificity (percentage of non-AD cases with the relative proportions of the 7650 mutant base below a selected value). From this curve, it can be seen that 20% of all AD cases have levels of this mutant allele exceeding those of any control case (20% sensitivity, 100% specific).

