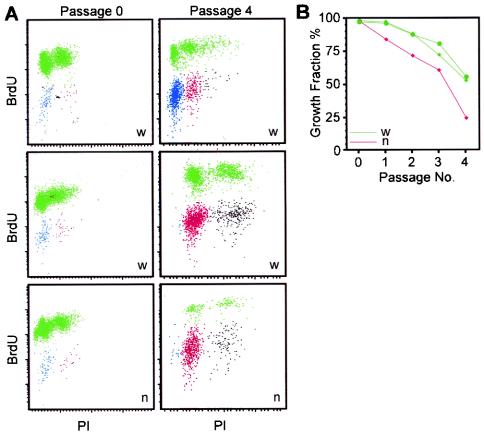
FIG. 2.
Growth fraction of Cited2−/− mouse embryonic fibroblasts. (A) Scattergrams of nuclear DNA synthesis (BrdU) vs. DNA content (PI) of Cited2+/+ (w) and Cited2−/− (n) fibroblast cultures at passages 0 and 4. BrdU-labeled cells are indicated in green. Unlabeled cells are indicated in blue (2n), red (4n), or black (8n DNA content). (B) Growth fraction of Cited2−/− and Cited2+/+ fibroblast cultures plotted against passage number.

