FIG. 7.
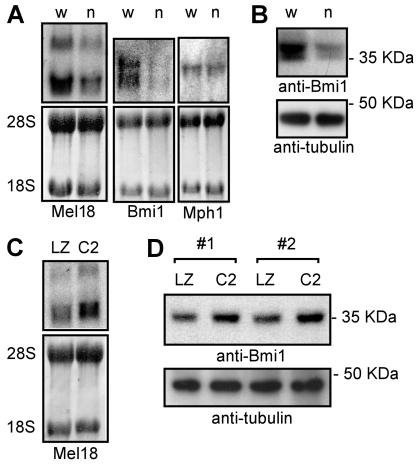
Expression of Mel18 and Bmi1 in fibroblasts lacking Cited2. (A) Northern blots of total RNA obtained from Cited2+/+ (w) and Cited2−/− (n) fibroblasts derived from littermate embryos. The top panels show blots probed for Mel18, Bmi1, or Mph1, as indicated. Two Mel18 isoforms are noted (52). The bottom panels show 28S and 18S RNA species to show equal loading. (B) Western blot of total cell lysate probed with an anti-Bmi1 monoclonal antibody (top) and reprobed with an antitubulin monoclonal antibody (bottom) to show equal loading. (C) Northern blot of total RNA obtained from Cited2−/− fibroblasts infected in parallel with retroviruses. LZ indicates infection with LZRS (control) retrovirus, and C2 indicates infection with CITED2-expressing retrovirus. The top panel shows a blot probed with a Mel18 cDNA. The bottom panel shows 28S and 18S RNA species to show equal loading. (D) Western blot of total cell lysate from Cited2−/− fibroblasts. LZ indicates infection with LZRS (control) retrovirus and C2 indicates infection with CITED2-expressing retrovirus. The experiment was performed in duplicate using independently isolated Cited2−/− fibroblast lines (nos. 1 and 2). The top panel shows a blot probed with an anti-Bmi1 antibody. The bottom panel shows a blot probed with an antitubulin antibody to show equal loading.

