FIG. 3.
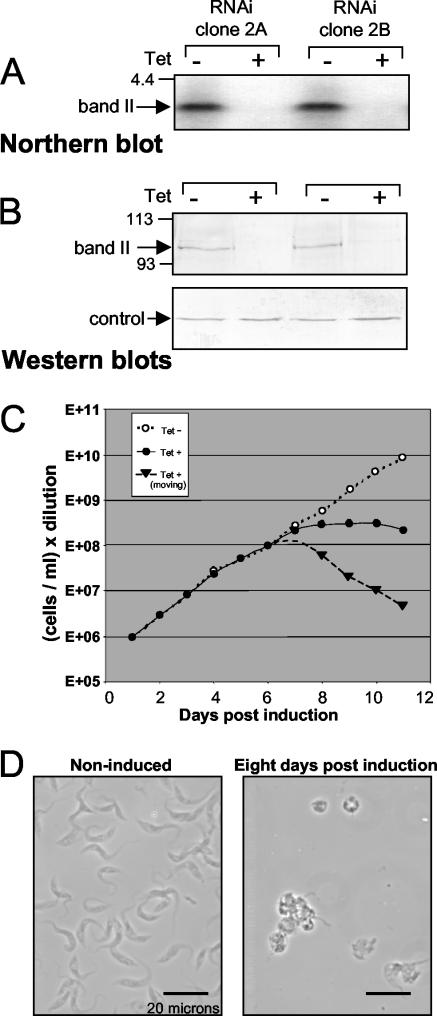
Band II RNAi. (A) Northern blot of band II-specific RNA from two clonal band II RNAi cell lines, noninduced or 24 h postinduction. (B) Western blot of band II-specific protein from the two clonal band II RNAi cell lines, noninduced or 5 days postinduction. (C) Growth curve of band II RNAi cells, noninduced (white dots) or induced, showing total cells (dark dots) and the cells that remain healthy-looking, i.e., elongated and undulating (triangles). (D) Typical view of band II RNAi cells, noninduced or 8 days postinduction.

