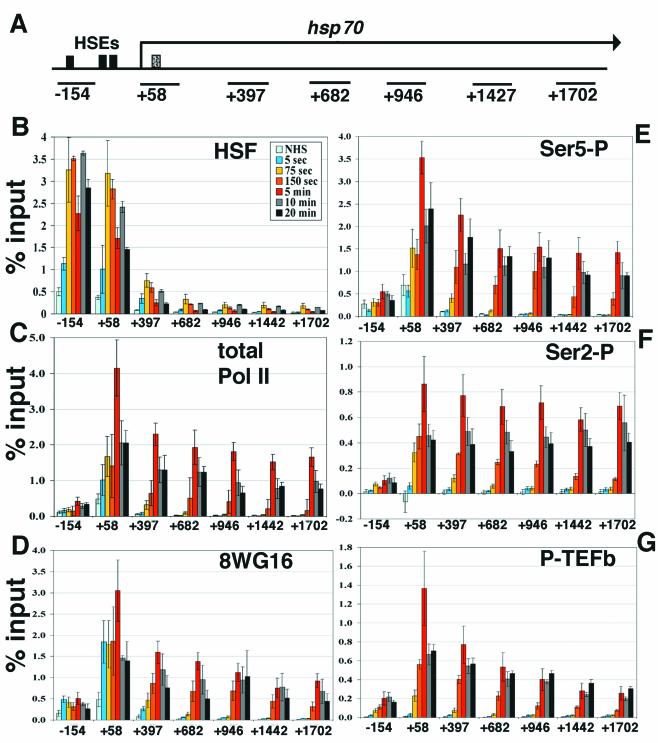
FIG. 1.
Kinetic analyses of hsp70 transcription by ChIP and real-time PCR. (A) Schematic of hsp70. Solid black boxes indicate HSE sites (−175, −75, −55 from transcription start site) (54), and the dotted box indicates the site of paused Pol II (+21 to +35) (39). Black lines below the gene indicate the regions amplified by primer sets (see Materials and Methods), identified by the nucleotide at the center of the amplified region. (B) Time course of HSF recruitment on hsp70. ChIP samples were taken at several time points, analyzed by real-time PCR with the primer sets along hsp70 shown in panel A, and compared to percentage input material. Samples shown are NHS and 5-s, 75-s, 150-s, 5-min, 10-min, and 20-min instantaneous heat shock. The x axis is the hsp70 gene in nucleotides, and the y axis is percentage input. The identity of each time point line is located in the upper right-hand corner of the graph. Standard error bars are shown; n = 4, 3, 7, 4, 4, 5, and 4, respectively. (C) Kinetics of total Pol II. Standard error bars are shown; n = 4, 4, 8, 3, 4, 4, and 4, respectively. (D) Antibody 8WG16, which detects unphosphorylated Pol II CTD repeats. Standard error bars are shown; n = 4, 4, 7, 4, 5, 4, and 4, respectively. (E) Time course of Ser5 phosphorylation, detected by antibody H14. Standard error bars are shown; n = 4, 3, 7, 4, 5, 4, and 4, respectively. (F) Ser2 phosphorylation kinetics on hsp70, detected by H5. Standard error bars are shown; n = 4, 4, 8, 3, 4, 4, and 4, respectively. (G) ChIP analysis of P-TEFb by using an antibody to CycT. Standard error bars are shown; n = 3, 3, 8, 4, 5, 4, and 4, respectively.

