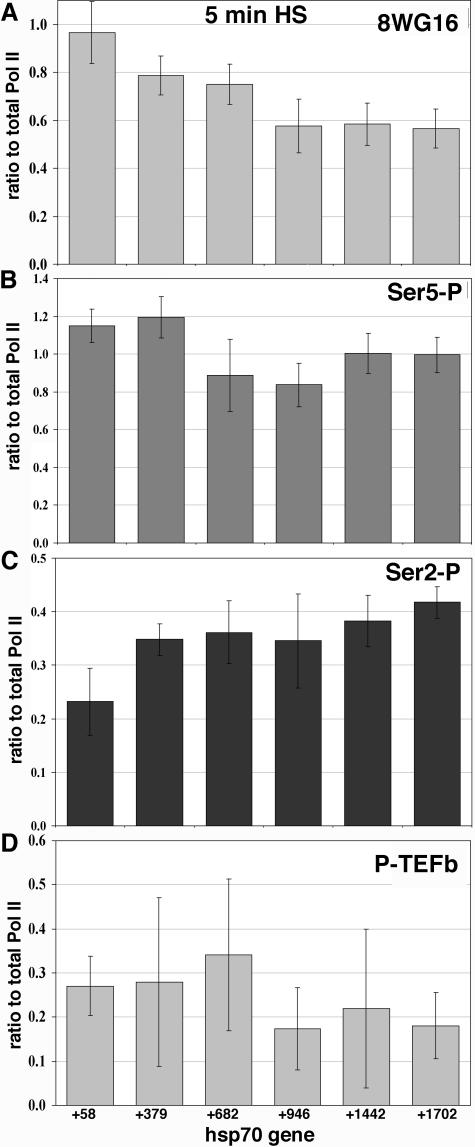
FIG. 4.
Tracking the Pol II modifications and P-TEFb association with Pol II relative to total Pol II levels at the peak of factor association during heat shock. For each gene region the value for the Pol II phosphorylation state or for P-TEFb was divided by the value for total Pol II at 5 min of heat shock (thus, total Pol II/total Pol II = 1). Antibody target is indicated in the upper right-hand corner of each graph. Standard deviation for each point is shown, determined by the square root of the sum of the squares of (i) the standard deviation oftotal Pol II for that gene region and (ii) the standard deviation associated with the values of each phosphorylation state. (A) Ratio of 8WG16, unphosphorylated Pol II CTD, to total Pol II. (B) Ratio of Ser5-P signal to total Pol II. (C) Ser2-P signal ratio to total Pol II. (D) The levels of P-TEFb compared to those of total Pol II.

