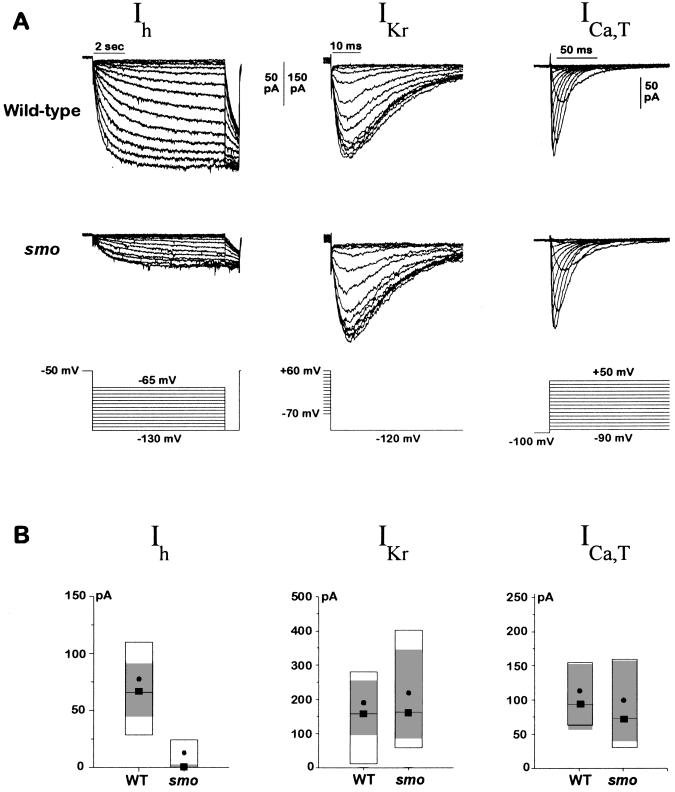
Figure 3.
Ih is reduced in smo cardiac myocytes. (A) Representative Ih, IKr, and ICa,T currents from wild-type and smo cells. Ih was elicited from a holding voltage of −50 mV by steps to various voltages (−65 to −130 mV in 5-mV increments). A test voltage of −130 mV was applied at the end of each hyperpolarizing step. IKr was activated by a ≈1-s prepulse to various voltages (+60 to −70 mV in 10-mV increments); the inwardly rectifying current was then measured at a constant test voltage of −120 mV. ICa,T was elicited from a holding potential of −100 mV to voltages ranging from −90 to +50 mV once every 2 s. Current traces were filtered at 1 kHz (Ih) or 5 kHz (IKr and ICa,T). (B) Amplitude of Ih, IKr, and ICa, T currents from many wild-type and smo cells. The data are displayed as box plots. The box delimits the central 50% of the data values. The median is shown as a solid line tagged with a solid box, and the mean is shown as a solid circle. The 99% confidence interval for a robust median is shown by the gray shaded zone. The confidence interval is based on the biweight locator and estimate of scale (25). Boxplots of the Ih current amplitudes are shown for wild-type (n = 47) and smo (n = 48) cells. Boxplots of the IKr current amplitudes also are shown for wild-type (n = 31) and smo (n = 23) cells and for ICa,T, wild-type (n = 20), and smo (n = 20) cells. The size of whole cell Ih currents in smo cells was very small (average 12.0 pA), making it difficult to fit some of the data to a Boltzmann function. The amplitude comparison between wild-type and smo cells was thus repeated but with recording conditions that were chosen to enhance the amplitude of the Ih currents. The bath solution was as described in Materials and Methods except that KCl was increased to 140 mM, 2 mM BaCl2 was added, and NaCl was omitted. The pipette solution was supplemented with 100 μM cAMP. The Ih current amplitude was indeed enhanced 2.5-fold by the changes in recording solutions, and the effects of the smo mutation on the Ih current were the same. For the Ih current, the confidence interval was 110–260 pA in wild-type cells (n = 19) compared with 5–44 pA in smo cells (n = 20). IKr current was again unchanged by the mutation: 99% confidence interval was 67–358 pA for wild-type (n = 20) and 109–261 pA for smo cells (n = 19). The reduction in Ih current in smo cells was not due to a difference in cell size between wild-type and smo because the cell capacitances were the same for the two genotypes; the 99% confidence interval on the robust median for wild-type (n = 34) was 2.3–3.2 pF and for smo (n = 28) was 2.4–3.1 pF. Data were obtained for both Ih and IKr from each cell whenever possible. The amplitude of the Ih current was determined as shown in Fig. 2A from the amplitude of the Boltzmann fit, and the amplitude of the IKr current was determined in an analogous fashion. The current amplitude for ICa,T was determined at −20 mV after leak subtraction. The leak current and nonlinear open channel properties were minimized for both the Ih and IKr records by taking all of the current amplitudes at a constant voltage. For each value in the legend, we report a range of numbers giving the 99% confidence interval for the robust median. WT, wild-type.

