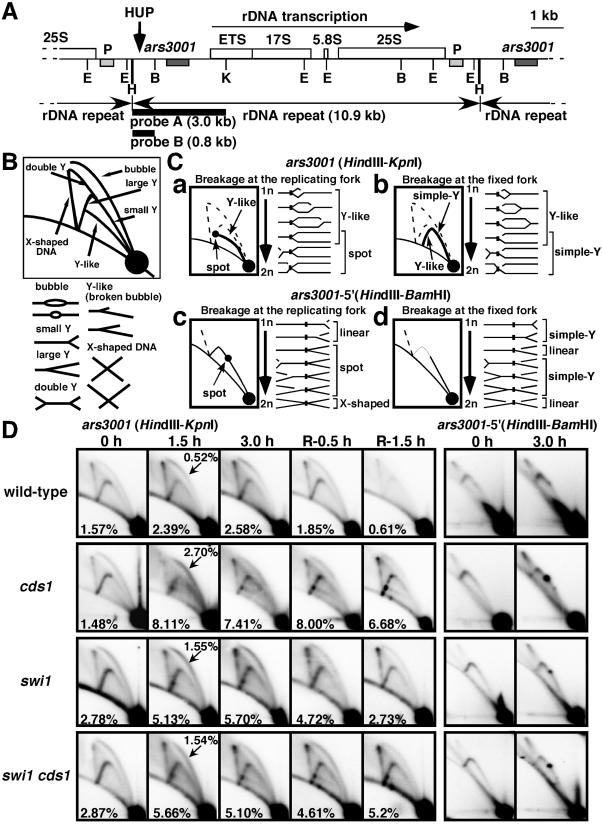
FIG.4.
2D gel analysis of replication forks in swi1 and cds1 mutants. (A) Map of the rDNA repeats as reported by Sanchez et al. (41). The ars3001 box indicates the origin region and the P box indicates a pause site mapped by Sanchez et al. (41). The HUP site is indicated, as are the probes and restriction enzyme sites (E, EcoRI; H, HindIII; B, BamHI; K, KpnI). (B) Diagram of the migration pattern of replication intermediates that can be detected by 2D gel electrophoresis. (C) Diagrams of potential Y-like arc and pause site patterns. (D) Wild-type and cds1, swi1, and swi1 cds1 mutant cells were incubated in YES liquid medium supplemented with 12 mM HU for the indicated times at 30°C. Genomic DNA prepared from cells was analyzed by 2D gel electrophoresis. The five columns on the left show 2D gels of DNA digested with HindIII and KpnI and hybridized with probe A. Cells were incubated with HU for 0, 1.5, or 3 h and then HU was washed out and cells were incubated for a further 0.5 or 1.5 h. Numbers in the panels indicate fractions of RIs relative to total signal. Numbers with arrows in 1.5-h samples represent fractions of bubble structures relative to total signal. The two columns on the right show gels digested with HindIII and BamHI and hybridized with probe B. Cells were incubated with HU for 0 or 3 h.

