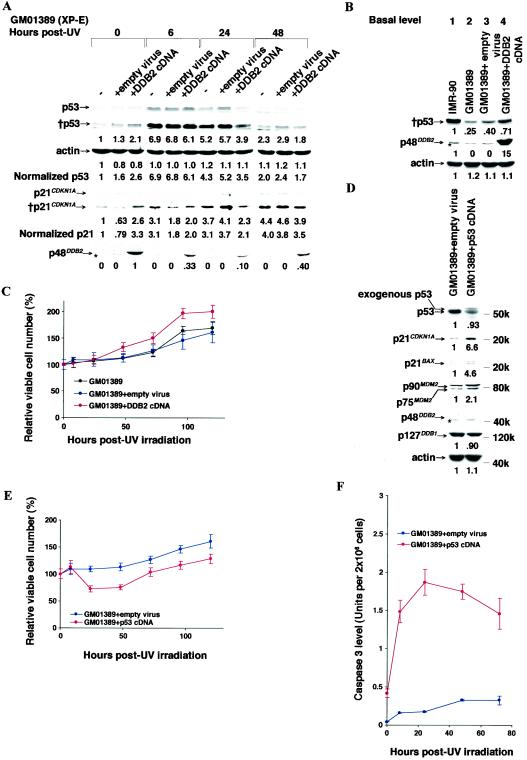
FIG. 4.
Effect of overexpression of DDB2 or p53 cDNAs upon p53 responses and cell viability after UV irradiation. (A and B) Levels of p53, p21CDKN1A, and p48DDB2 proteins and actin before and after 12 J of UV irradiation m−2 in the XP-E strain GM01389 stably infected with a Moloney murine leukemia virus that carried the DDB2 cDNA, as indicated. The stably infected cells were selected with G418 as described in Materials and Methods. −, no infection; +empty virus, infection with the empty viral vector and G418 selection; +DDB2 cDNA, infection with a DDB2 cDNA construct and G418 selection. The chemiluminescence exposure times were 20 s (p53), 3 min (†p53), 15 s (p21CDKN1A), 3 min (†p21CDKN1A), and 20 min (p48DDB2). The band marked with an asterisk lying just below p48DDB2 is nonspecific. (A) Levels of p53 and p21CDKN1A proteins were normalized to the basal protein level (0 h) of GM01389, which was designated as 1.0, and then the levels were normalized for the relative band intensities of actin. In the case of p48DDB2, the basal level (0 h) of GM01389 with the DDB2 cDNA was designated as 1.0 because endogenous p48DDB2 was undetectable. (B) Each protein level of the IMR-90 was designated as 1.0, and then the other protein levels werenormalized accordingly. (C) Effect of overexpression of DDB2 cDNA in the XP-E strain GM01389 upon cell viability as determined by dye exclusion after 12 J of UV irradiation m−2. The numbers of viable cells were determined by the dye exclusion assay before and after irradiation as described in Materials and Methods. Within an experiment, each point was determined in triplicate; each curve represents three (no infection and DDB2 cDNA infection) or four (empty virus infection) independent experiments. (D) Effect of exogenous p53 cDNA expression in the XP-E strain GM01389 upon basal protein levels of p53, p21CDKN1A, p21BAX, MDM2, p48DDB2, p127DDB1, and actin. (E and F) Cell viability as determined by dye exclusion (E) or caspase 3 activity (F) before and after 12 J of UV irradiation m−2. GM01389 cells were infected with virus containing the p53 cDNA, and stably infected cells were selected with G418. (D) The chemiluminescence exposure times were 3 min (p53 and p21CDKN1A), 5 s (p21BAX), 30 s (MDM2), 20 min (p48DDB2), and 10 s (p127DDB1 and actin). Each protein level of the GM01389+empty virus construct was designated as 1.0, and the respective levels of these proteins in the cells infected with p53 cDNA-containing virus were normalized to these values. The band marked with an asterisk is nonspecific. Note that in the XP-E strain infected with p53 cDNA, the bands are smeared. (E) The curve for p53 cDNA infection was determined by two independent experiments. (Within an experiment, each point was determined in triplicate.) (F) Caspase 3 activity was determined as described in Materials and Methods. Within an experiment, each point was determined in duplicate, and each curve represents two independent experiments.

