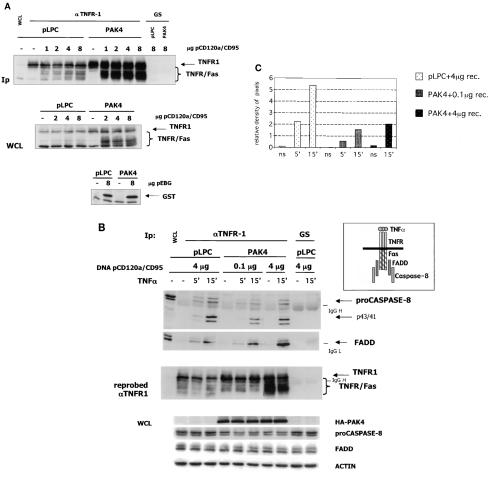
FIG. 6.
PAK4-expressing cells show decreased Fas DISC formation. (A) The transfected TNFR/Fas chimeric receptor in highly expressed in PAK4 cell lines. HeLa control (pLPC) or wild-type PAK4 cells were transfected with empty vector (−) or the indicated amounts (in micrograms) of TNFR/Fas chimeric receptor (pCD120a/CD95) or GST (pEBG) expression vector. After 48 h, cells were harvested and equal volumes of protein lysates (1/100 of total extracts) (WCL) were analyzed by Western blotting as described below or used for immunopurification (Ip) with goat antibodies against the extracellular domain of p55 TNFR (αTNFR1) or preimmune goat serum (GS). Immunopurified complexes and whole-cell lysates were fractionated by SDS-PAGE, transferred to polyvinylidene difluoride membranes, and probed with mouse antibodies against TNFR1 or GST. Specific bands are indicated by arrows on the right. Migration positions of the TNFR/Fas chimera are indicated by a brace. (B) Recruitment of caspase 8 is compromised in stable PAK4 cell lines. HeLa control (pLPC) or wild-type PAK4 cells were transfected with the indicated amounts (in micrograms) of TNFR/Fas chimeric receptor (DNA pCD120a/CD95) expression vector. After 48 h, cells were left untreated (−) or stimulated with 10 ng of TNF-α per ml for the indicated time in minutes and harvested. Equal volumes of protein lysates were analyzed by Western blotting as described below or used for immunopurification (1/100 of total extracts) with goat antibodies against the extracellular domain of p55 TNFR or preimmune goat serum. Immunopurified complexes were fractionated by SDS-PAGE, transferred to polyvinylidene difluoride membranes, and probed with mouse antibodies against caspase 8 or FADD. The blot probed with caspase 8 antibodies was stripped and reprobed with mouse antibodies against TNFR1 to verify TNFR1 and TNFR/Fas expression levels (as indicated at the left of the middle panel). Specific bands are indicated by arrows on the right. Migration positions of the TNFR/Fas chimera are indicated by a brace. Migration positions of IgG heavy and light chains are also indicated. To verify equal loading, the lysates (WCL) were analyzed by Western blotting for PAK4 (HA-PAK4), full-length caspase 8 (proCaspase8), FADD, and actin, as indicated. A diagram of the proteins interacting with the Fas intracellular domain of the TNFR/Fas chimeric receptor is also shown. (C) Quantitation of the caspase 8 signal in the DISC shows reduced caspase 8 protein per amount of receptor in PAK4 cells. The pro-caspase 8 bands of the top panel of panel B and the TNFR1 and TNFR/Fas bands (receptor) of the middle panel of panel B (pLPC and PAK4 lanes) were quantitated by densitometry (NIH Image). The densities of pixels in equal areas were measured, and backgrounds (measured in the GS Ip lanes) were subtracted. Receptor amounts for the single Ips were expressed as values relative to the amount of receptor present in the pLPC (ns) Ip lane. The relative amount of caspase 8 pixels shown in the graph was obtained by dividing the measured value of caspase 8 by its relative receptor levels (relative density of pixels). (The lowest relative value obtained [PAK4 ns lane] was similar to background levels and was set as the zero point of the y axis.)

