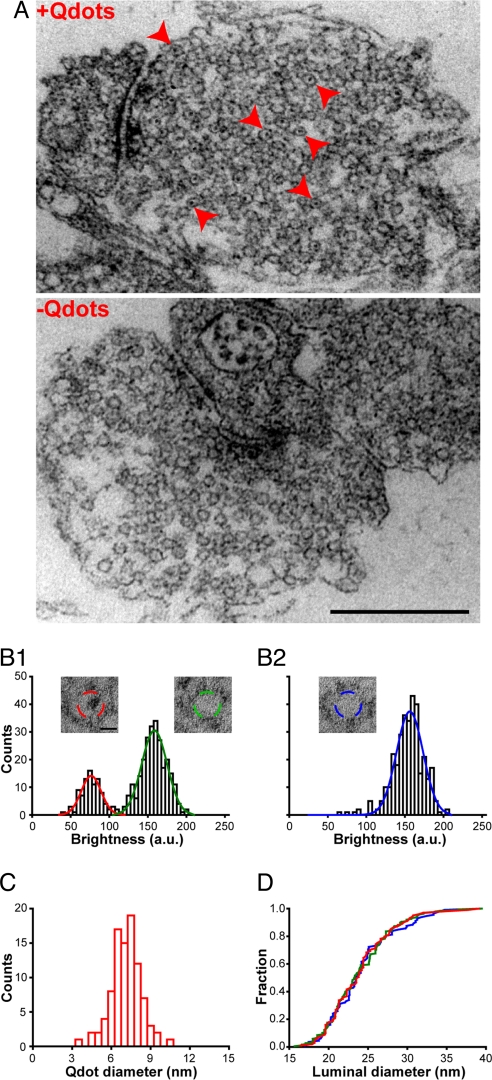
Fig. 3.
Only one Qdot is localized in the lumen of one synaptic vesicle. (A) Samples of Qdot-loaded synapse (+Qdots) and control (−Qdots). Red arrowheads point to vesicles containing electron dense puncta. (Scale bar, 500 nm.) (B) Distributions of luminal intensities (ROI indicated by dashed circles in Insets) of vesicles from four Qdot-loaded synapses (B1) and four control synapses (B2), with sum-of-Gaussian fits. A separate peak (red curve) is obvious in B1. (Insets) Exemplars of Qdot-positive vesicles and Qdot-negative vesicles at Qdot-loaded synapses and vesicles at control synapse. (Scale bar, 10 nm.) (C) Distribution of the diameters of electron dense puncta in vesicles at Qdot loaded synapses. (D) Cumulative distribution of inner diameters of Qdot-containing vesicles (red), empty vesicles in Qdot-loaded synapses (green), and vesicles in control synapses (blue). No significant differences (Kolmogorov–Smirnov test, P > 0.1 for red vs. green, and P = 0.9 for red vs. blue) were observed.

