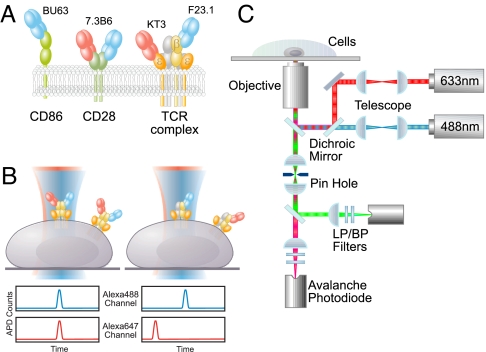
Fig. 1.
Two-color coincidence detection microscopy. (A) Drawings, approximately to scale, of the proteins, that is, CD86, CD28, and the TCR complex, and the fragments of antibodies (red and blue), that is, BU63 (anti-CD86), 7.3B6 (anti-CD28), KT3 (anti-CD3ε), and F23.1 (anti-TCRβ) used in this study. A TCR complex composed of a single αβ heterodimer is shown. (B) Diagrammatic representation of two types of TCR complex, that is, TCRs comprising two αβ heterodimers (Left) or a single αβ heterodimer (Right), bound to Alexa488 (blue)- and Alexa647 (red)-labeled anti-TCRβ Fab fragments. On dual-color excitation, a fraction of the complexes in Left will produce fluorescence from both fluorophores, whereas those in Right will only ever exhibit single-color fluorescence. The expected avalanche photodiode (APD) output, against time, for each scenario is also shown. (C) Schematic view of the experimental apparatus used for dual-color excitation and two-color coincidence detection (LP/BP, long pass/band pass filters).

