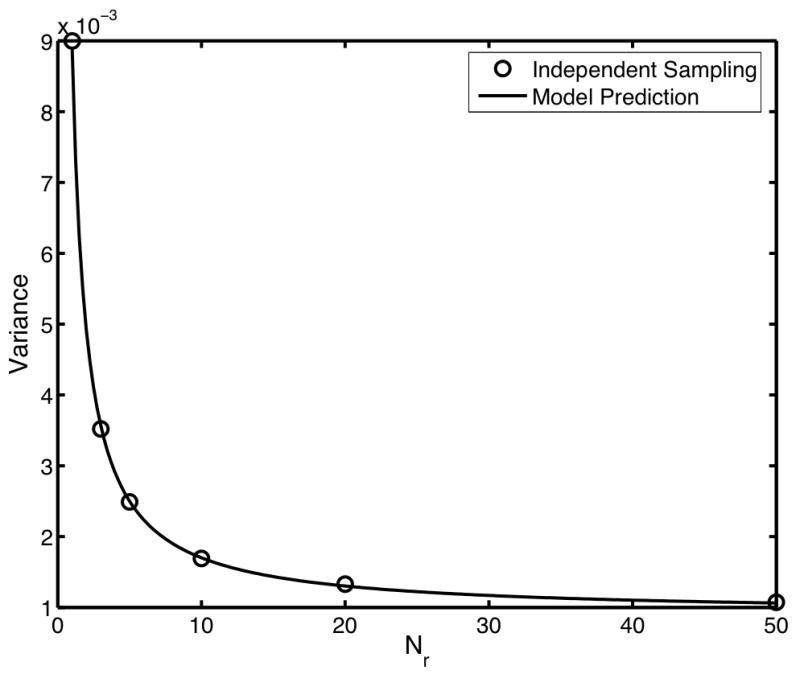
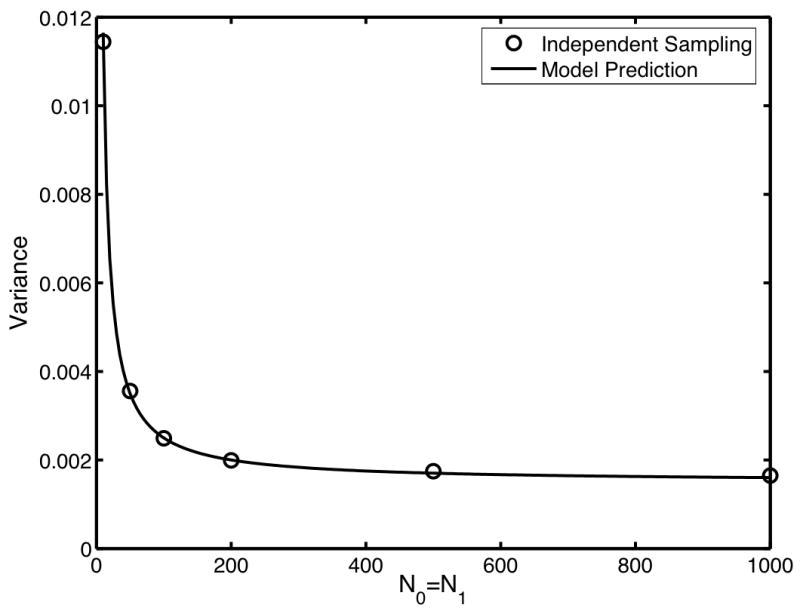
Fig. 1.


Comparison of the variances predicted using direct computation of the expansion coefficients (solid line) to empirical estimates of the variance computed using independent sampling (circles). In (a), Nr is varied from 1 to 50 with both N0 and N1 fixed at 100. In (b), Nr was fixed at 5 while both N0 and N1 were varied from 10 to 1000. For the independent sampling, 10,000 repetitions were used.
