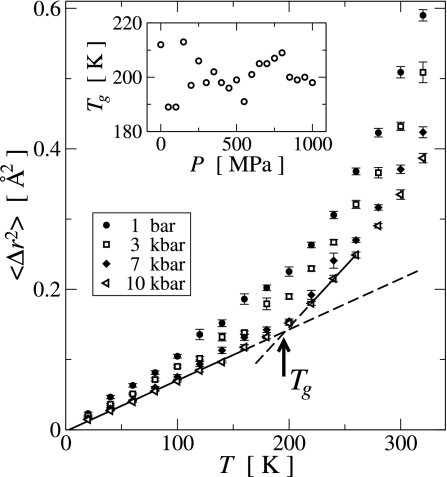
Fig. 3.
Temperature dependence of the hydrogen mean-square displacements during a time interval τ = 1 ps for selected pressure values. (Inset) The pressure dependence of the transition temperature Tg, calculated as the intersection between two linear fits to 〈Δr2〉P(T) in the ranges T ≤ 160 K and 220 K ≤ T ≤ 260 K, respectively, as illustrated for the 1,000 MPa data by the solid (fit region) and dashed (continuation outside fit region) lines.

