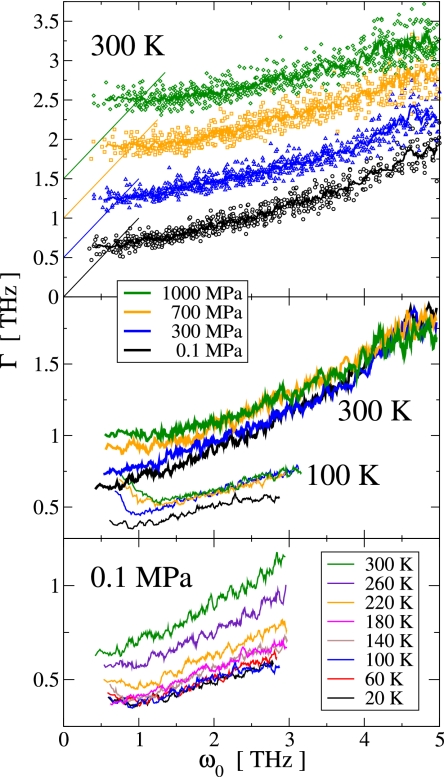
Fig. 6.
Eigen and damping frequencies ω0 and Γ, respectively, of the low-frequency principal component modes for selected pressure and temperature values. (Top) Symbols show {ω0, Γ} for individual modes and thick solid lines represent running averages. For clarity, data sets for different pressure values are vertically offset by 0.5 THz. The thin solid lines indicate critical damping, Γ = ω0. (Middle) Comparison of the damping frequencies at 300 K (thick solid lines) and 100 K (thin solid lines) for the same pressure values as in Top. (Bottom) Comparison of the damping frequencies at 0.1 MPa and various temperatures.

