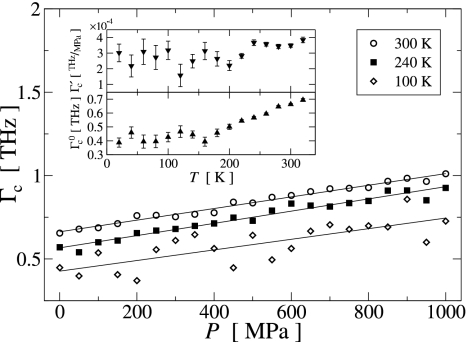
Fig. 7.
Pressure dependence of the critical damping frequency Γc for selected temperatures. Symbols represent data points, and the solid lines are linear fits. The temperature dependence of the slope Γ′c and intercept Γc0 of each linear fit to Γc(P) are presented in Upper and Lower Insets, respectively.

