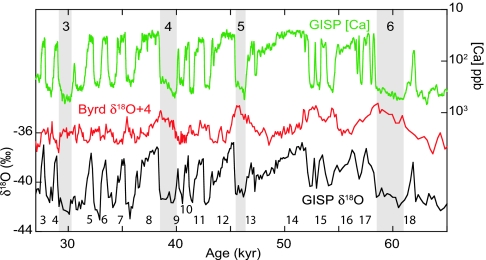
Fig. 1.
Relations between dustiness over Greenland (represented by [Ca] from the GISP2 ice-core; ref. 31) and temperature variability in Antarctica (7) and Greenland (54) during the last glacial period (all records are temporally aligned using methane correlation; ref. 36). Upper numbers denote Heinrich events, and lower numbers denote canonical D–O events (2). Changes in Greenland dust during Heinrich stadials tend to resemble Antarctic temperature variability.

