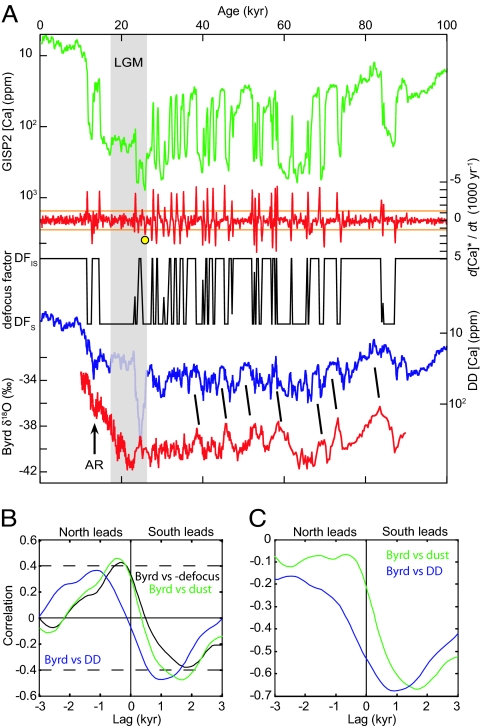
Fig. 2.
Dejumping the GISP2 dust record. (A) From top to bottom are: GISP2 [Ca] record (31), first time differential of log10 [Ca] (d[Ca]*/dt) with upper and lower limits (±1.15, SD) for picking D–O transitions in orange (yellow circle within the last glacial maximum (LGM) represents the second of two consecutive abrupt increases in dust; see SI Text), defocusing function (DFis and DFs are the interstadial and stadial values, respectively, SI Text), the DD record and Byrd δ18O (36). AR is the Antarctic reversal. (B) Lead/lag correlations of the raw and DD records and the defocusing factor versus Antarctic temperature for the interval 85–30 kyr ago after removal of orbital-scale variability (records are hi-pass filtered at 7,000 yr and lo-pass smoothed at 200 yr; see SI Text). The DD record shows similar maximum correlative power to the unprocessed record but is shifted in time with maximum correlation attained when southern temperature leads DD by up to 1,000 yr. (C) Same as B but without high-pass filtering.

