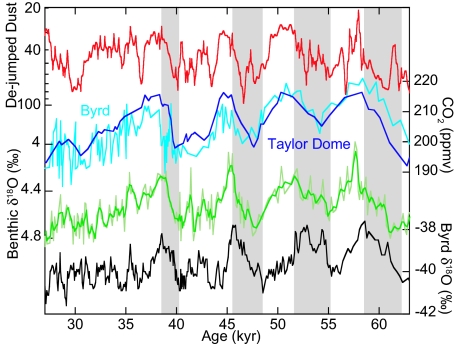
Fig. 4.
The DD record as compared with atmospheric CO2 [from the Byrd (25) and Taylor Dome (24) ice cores], deep Atlantic benthic foraminiferal δ18O (plus 3-point running mean) (5) and Antarctic temperature (7). All records are on the GISP2 time scale. The two records of CO2 have been detrended by subtraction of a linear decrease of 0.3 ppmv/kyr centered on 45 kyr ago. Shaded gray areas loosely define warming periods in Antarctica. The DD, CO2, and benthic δ18O records all display apparent time delays behind the Antarctic record. See also SI Text and SI Fig. 8.

