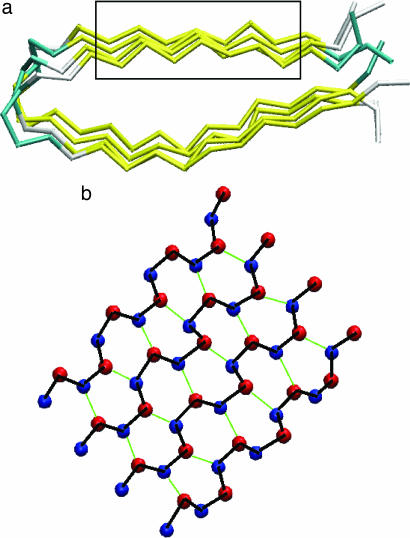
Fig. 5.
Parallel β-sheets from a structural model of CA150.WW2 protofilaments forming amyloid fibrils [Protein Data Bank (26) entry 2NNT]. The model is based on distance constraints obtained by means of magic angle spinning (MAS) NMR spectroscopy (27). (a) Side view of the two β-sheets (in yellow) forming the hairpin structure of the whole protofilament. Cα backbone representation is used (28). (b) Top view of the β-sheet included in the rectangular box in a. The representation used in b employs virtual interaction centers based on main backbone atom positions. Blue (red) spheres are placed in the middle of the N–H (C–O) bonds and lie approximately in the same plane. Thick black lines are drawn to connect interaction centers along the same β-strand. Thin green lines are drawn to represent interactions (i.e., virtual hydrogen bonds) between neighboring strands.

