Fig. 3.
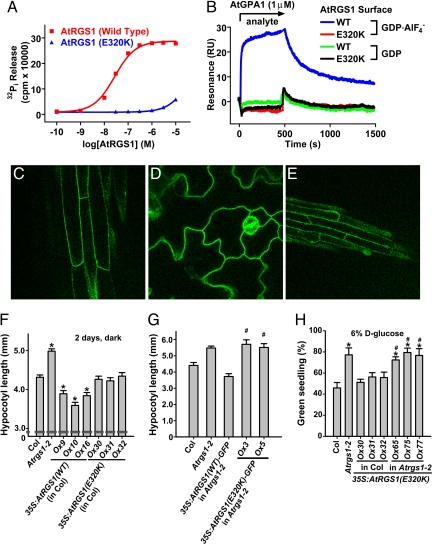
In vitro and in vivo characterization of AtRGS1(E320K) as a GAP-dead mutant. (A) Dose–response analysis of AtGPA1 steady-state GTPase acceleration by wild type (WT) and E320K AtRGS1. GTPase assays were conducted for 20 min with 200 nM AtGPA1, and EC50 values were determined by regression for WT as 2.7 (95% C.I., 2.4–3.1) × 10−8 M and for the E320K mutant as 4.5 (95% C.I., 4.3–4.7) × 10−5 M. For these EC50 regression analyses, it was assumed that the E320K mutant has the same efficacy as WT protein. (B) Surface plasmon resonance was used to measure the interaction between AtRGS1 and AtGPA1. WT or E320K GST-AtRGS1 was immobilized on a biosensor surface. Then 1 μM AtGPA1 in the GDP or GDP-AlF4−-bound form was injected over the biosensor surface. Nonspecific binding to GST was subtracted from all curves. (C–E) AtRGS1(E320K)-GFP localization was visualized in Arabidopsis hypocotyls (C), cotelydons (D), and roots (E) by using epifluorescence microscopy. (F) Hypocotoyl lengths of 2-day-old, dark-grown seedlings were measured. Genotypes: 35S:AtRGS1(WT or E320K) (wild-type or E320K AtRGS1 constitutive overexpression lines). Multiple independent overexpression lines were generated and analyzed; individual lines are denoted Ox. Statistical significance was determined by Bonferroni's test (*, P < 0.05 vs. Col). (G) Experiments were performed as in F, but Arabidopsis-expressing AtRGS1-GFP-fusion proteins were used. Statistical significance was determined by Bonferroni's test (*, P < 0.05 vs. Col; #, P > 0.05 vs. Atrgs1–2). (H) Seedlings of the indicated genotypes were grown on 6% glucose, and the percentage of seedlings with green cotyledons was quantified. All genotypes had 100% green seedlings when grown on 1% glucose. Genotypes are described in F. Statistical significance was determined by Bonferroni's test (*, P < 0.05 vs. Col; #, P > 0.05 vs. Atrgs1–2).

