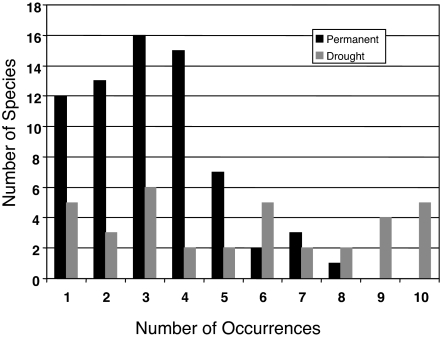
Fig. 1.
The number of species that occurred in each pond (of 10 possible) for the permanent (black) and drought (gray) ponds. In permanent ponds, the majority of species occurred in <1/2 of the ponds, and no single species occurred in every pond. Of the species observed in at least one of the permanent ponds, each was observed in 3.21 [±1.65 (SD)] of the 10 permanent ponds, whereas of the species observed in at least one of the disturbed ponds, each was observed in 5.26 [±3.1 (SD)] of the 10 drought ponds (ANOVA: F1,108 = 20.78, P = 0.001).

