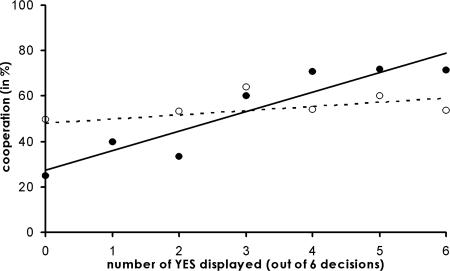
Fig. 2.
Elicited cooperation dependent on observed cooperation. Filled circles and line show the percentage of players cooperating and regression line [y = 8.6x + 27.4, r2 = 0.86, F (1,5) = 30.78, P < 0.005] dependent on how many YES decisions they saw out of six decisions of their partner. Open circles and dotted line [y = 0.02x + 0.48, r2 = 0.29, F (1,5) = 2.028, P = 0.21] represent the resulting cooperation after the original information (x axis) was transmitted by gossip.

