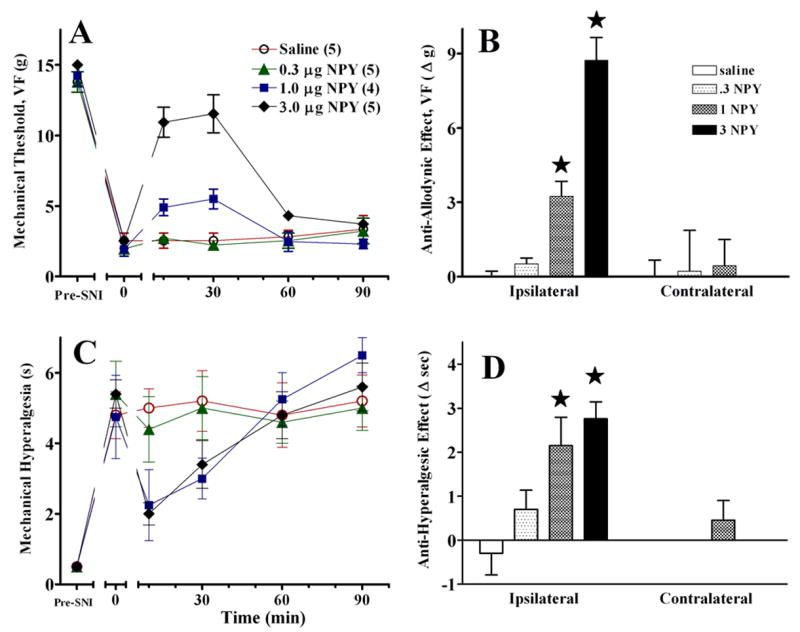
Figure 6. Intra-RVM NPY dose-dependently decreases PSNL-induced allodynia and hyperalgesia.

The line graphs in panels A and C illustrate time course data collected from the paw ipsilateral to SNI. The histograms in panels B and D summarize the change in von Frey threshold from baseline (t=0) to post injection (mean of timepoints 10–30) at the ipsilateral and contralateral sides. Error bars = SEM. Numbers of animals in each group are in parenthesis. ★P<0.05, Mann-Whitney U test subsequent to Kruskal Wallis (A–B) or post-hoc Bonferroni subsequent to repeated-measures ANOVA (C–D).
