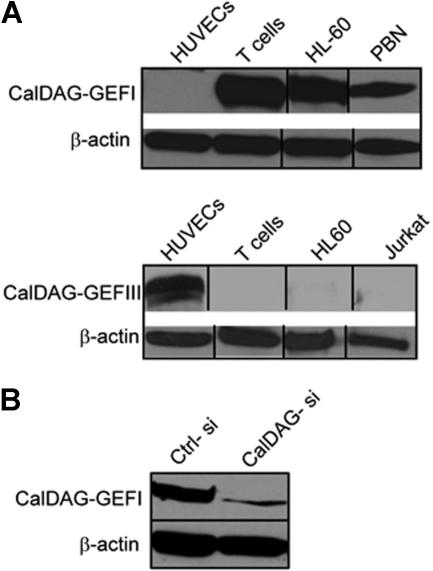
Figure 3.
CalDAG-GEFs protein expression. (A) Western blot analysis of human T cells, peripheral blood neutrophils (PBN), human umbilical vain endothelial cells (HUVECs), HL60 promyelocytic cell line, and Jurkat T cells using specific mAb for CalDAG-GEFI (top) and CalDAG-GEFIII (bottom). (B) T cells were transfected with CalDAG-GEFI-specific (CalDAG-si) or control nonsilencing (Ctrl-si) siRNA, and total lysates were immunoblotted with mAb to CalDAG-GEFI. β-actin is shown as loading control. Representative blots are shown. Two to 5 independent experiments were done for each panel. Vertical lines have been inserted to indicate a repositioned gel lane.

