
Figure 5.
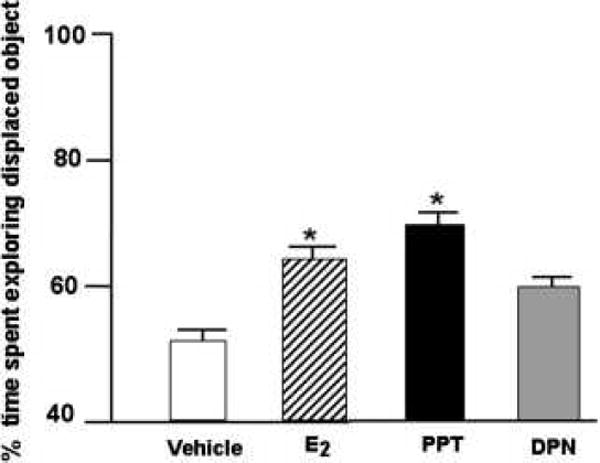
Mean percent (± standard error) of time ovx rats administered post-training E2 (n=17; stripped bar), PPT (n=17; filled bar), or DPN (n=17; shaded bar) rats spent exploring the displaced object as compared to ovx vehicle controls (n=17). * Indicates significant difference from ovx (p ≤ 0.05).